There are no items in your cart
Add More
Add More
| Item Details | Price | ||
|---|---|---|---|

Understanding Head and Shoulder and Inverted Head and Shoulder patterns, their meaning, formation, and trading approach.
Introduction
Technical analysis is built on the idea that price reflects collective market psychology. Among the many chart patterns traders use, Head and Shoulder and Inverted Head and Shoulder stand out for their clarity and reliability. These patterns often appear near important trend reversals and help traders identify potential turning points with defined risk and reward.
What Is the Head and Shoulder Pattern
The Head and Shoulder pattern is a bearish reversal formation. It usually appears after a strong uptrend and signals that buying momentum is weakening.
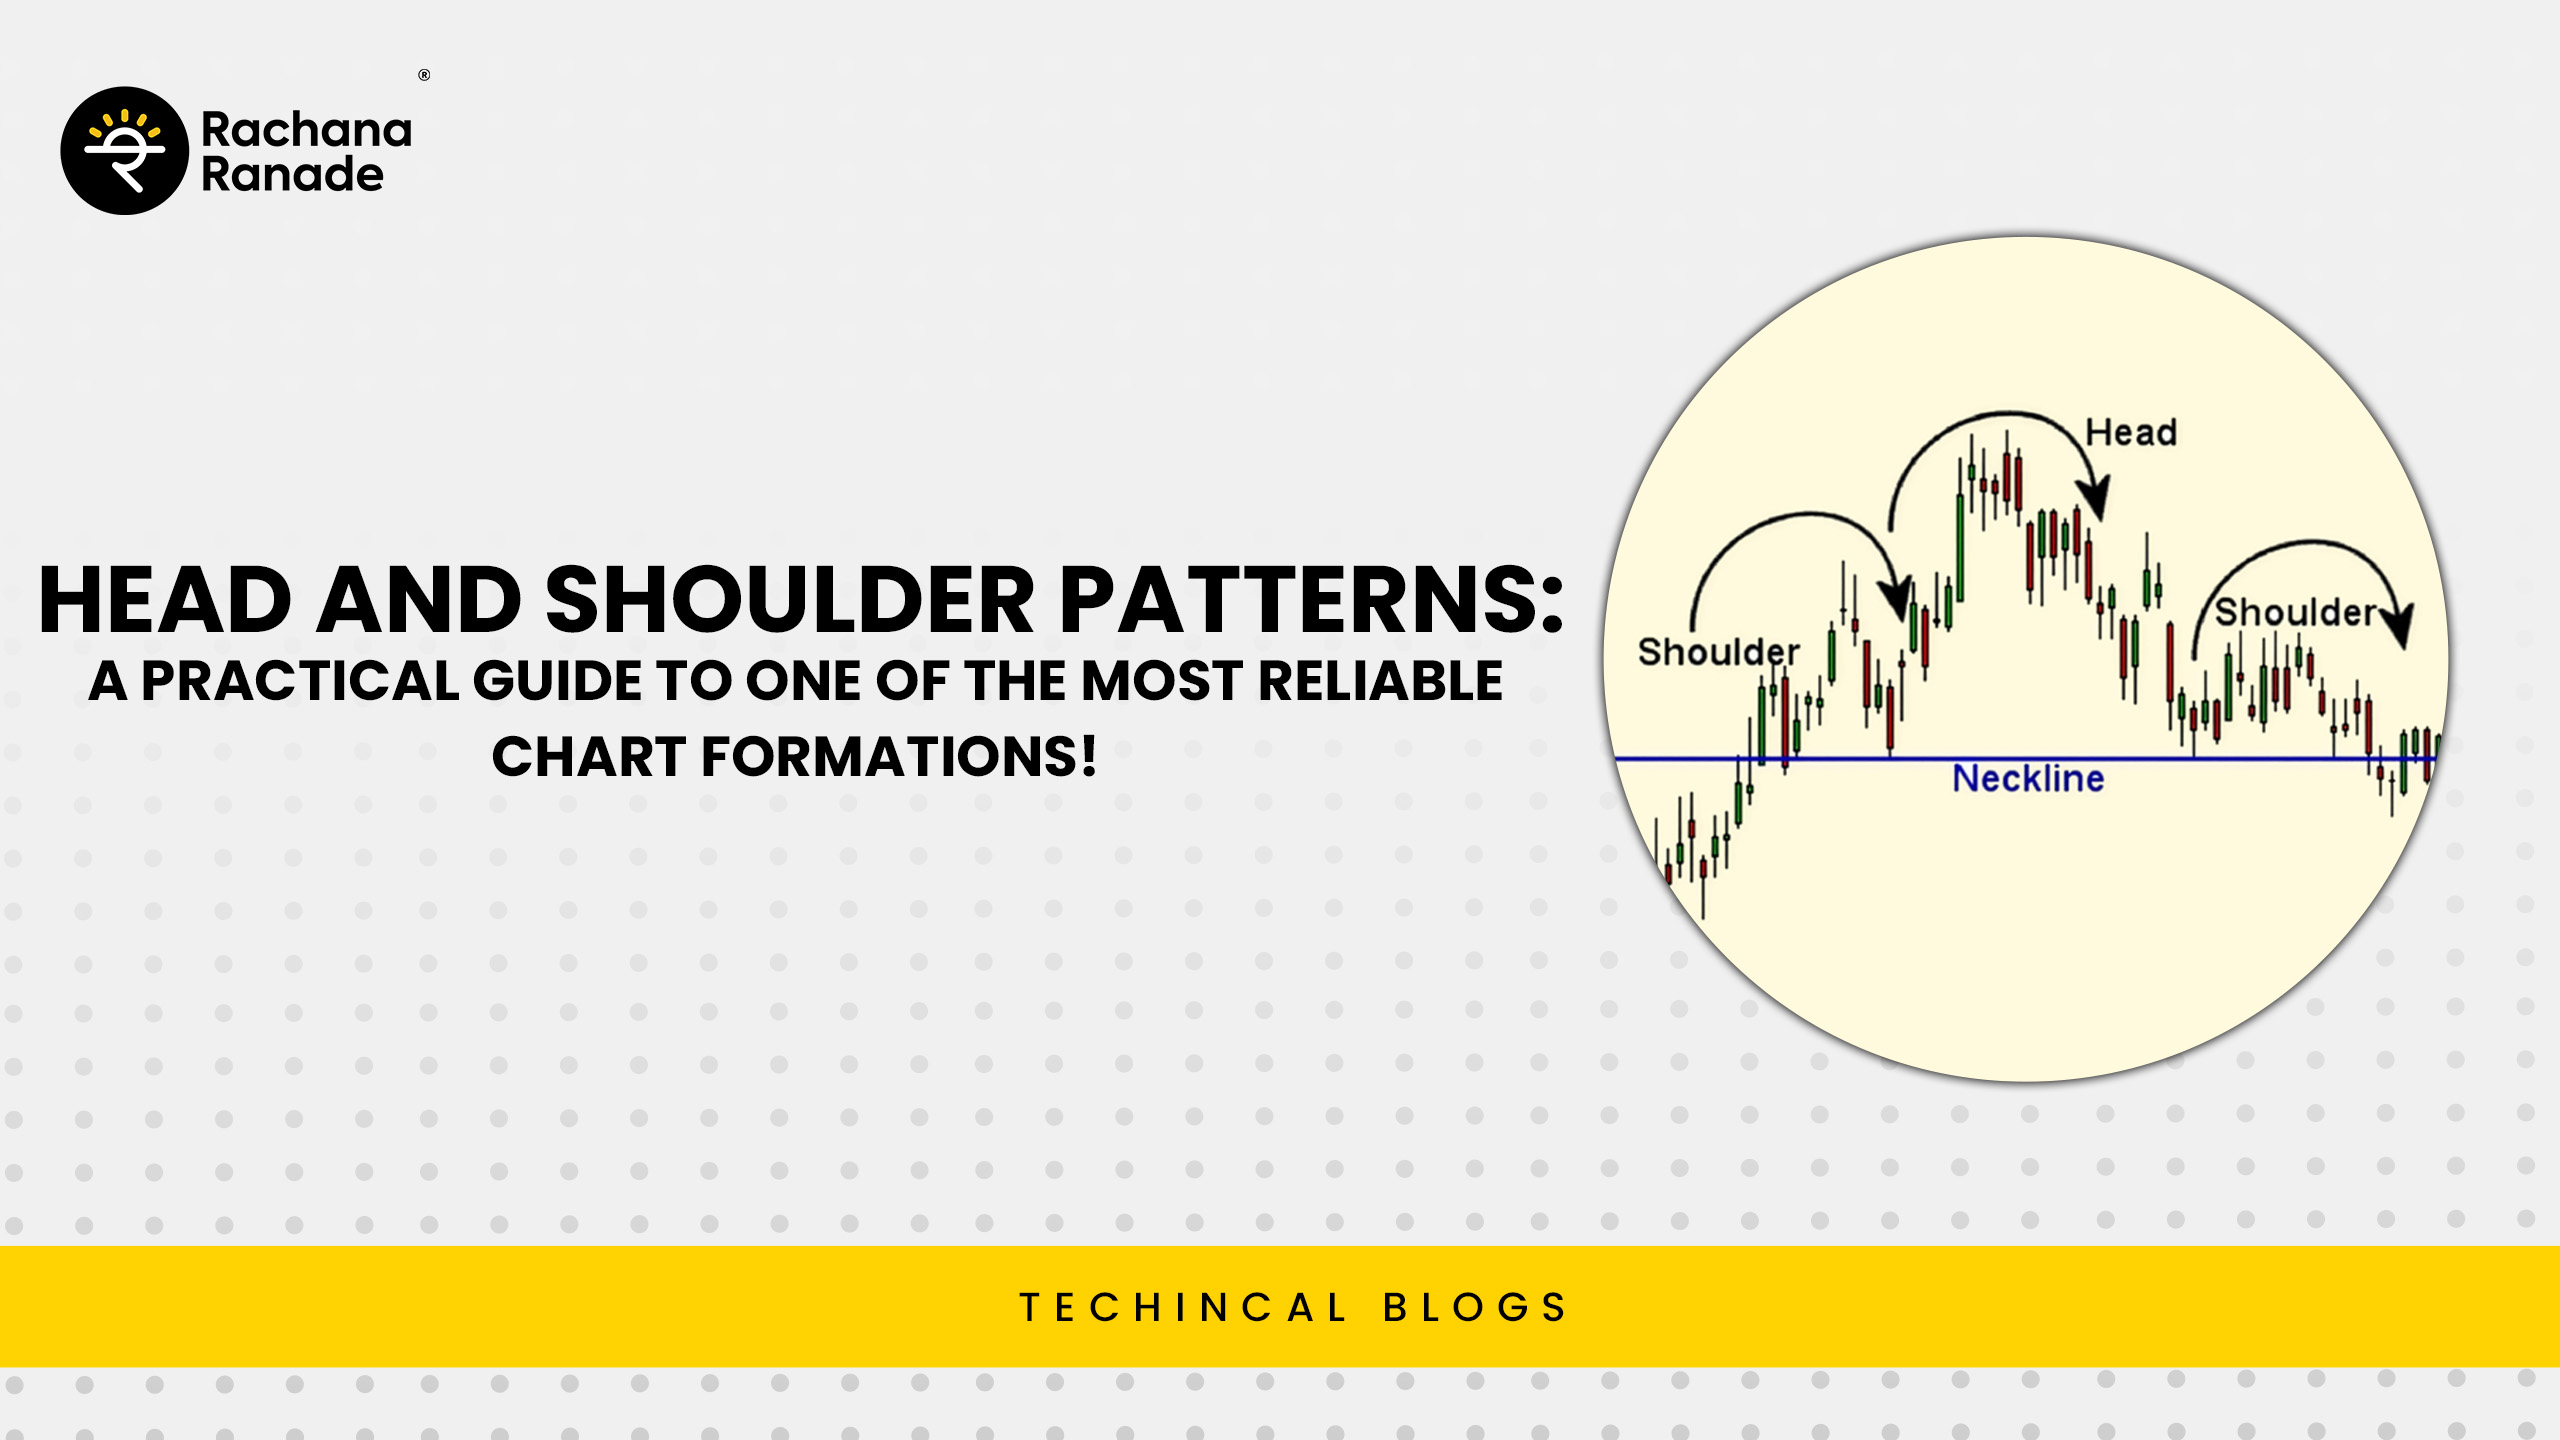
The Head and Shoulder pattern consists of three peaks formed during an uptrend. The left shoulder appears after an advance followed by a pullback, reflecting continued buying confidence. The head is the highest peak, created when buyers make one final push to new highs but face increasing selling pressure on the decline. The right shoulder forms at a lower high, signalling that buyers are losing strength and are no longer able to sustain upward momentum. The lows between these peaks connect to form the neckline, and a decisive break below this level confirms the shift in control from buyers to sellers and marks the completion of the pattern.
Where the Head and Shoulder Pattern Is Usually Seen
Head and Shoulder patterns are most reliable on daily and weekly charts, especially in stocks that have seen a prolonged uptrend. They are commonly observed near market tops, sector peaks, or after periods of excessive optimism.
What Is the Inverted Head and Shoulder Pattern
The Inverted Head and Shoulder is the bullish counterpart. It typically appears after a downtrend and signals a potential trend reversal to the upside.
The Inverted Head and Shoulder pattern is formed by three troughs during a downtrend. The left shoulder appears as a decline followed by a temporary bounce, while the head represents a deeper fall that reflects peak pessimism and aggressive selling. The right shoulder then forms at a higher low, signalling that sellers are losing strength and are no longer able to push prices to new lows. The highs between these troughs connect to form the neckline, and a decisive breakout above this level confirms a shift in control from sellers to buyers, often marking the beginning of a new uptrend.

Bullish or Bearish Nature of These Patterns
The Head and Shoulder pattern is bearish and signals a potential downside move once the neckline is broken. The Inverted Head and Shoulder is bullish and signals a possible upside move after a breakout above the neckline. In both cases, volume confirmation strengthens the signal. Rising volume on the breakout adds reliability to the pattern.
How to Trade Head and Shoulder Patterns
For a Head and Shoulder pattern, traders usually enter a short position or exit long positions after a clear break below the neckline. The stop loss is placed above the right shoulder. The price target is calculated by measuring the distance from the head to the neckline and projecting the same distance downward from the breakout point.
For an Inverted Head and Shoulder, traders look to enter long positions after a breakout above the neckline. The stop loss is placed below the right shoulder. The target is calculated by measuring the distance from the head to the neckline and projecting it upward from the breakout level.
Stocks to Observe and Practice Pattern Identification
Below are two stocks. Observe their daily or weekly charts and check whether you can identify a Head and Shoulder or an Inverted Head and Shoulder pattern. Pay attention to neckline structure, volume behavior, and whether the breakout is clean and decisive
1. Container Corporation of India Ltd
2.Reliance Industries Ltd
Conclusion
Head and Shoulder and Inverted Head and Shoulder patterns capture the transition between accumulation, distribution, and trend reversal. When combined with proper risk management through well defined stop losses and realistic targets, these patterns can offer structured trading opportunities. Like all technical tools, they work best when used with confirmation, patience, and discipline rather than in isolation.