There are no items in your cart
Add More
Add More
| Item Details | Price | ||
|---|---|---|---|


In the world of technical analysis, breakouts/breakdowns are powerful signals that can help traders anticipate major market moves. One of the most significant patterns for identifying potential short-selling or downside opportunities is the Horizontal Support Breakdown.
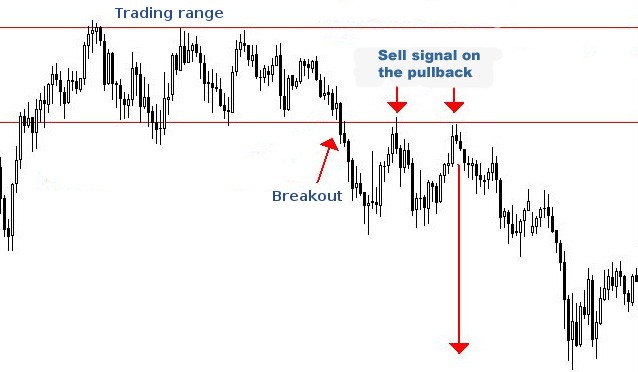
A horizontal support breakdown occurs when the price of a stock breaks below a well-defined support level that has repeatedly prevented the price from falling further.
Support Level: A support level is where buying pressure historically halts price declines. When price repeatedly fails to break below a flat level, it forms horizontal support, seen as a straight line on the chart.
Breakdown: A breakdown happens when the price convincingly closes below this support level, signalling a potential shift in market sentiment from bullish or neutral to bearish.
How to Trade a Horizontal Support Breakdown
Entry Point
A retest happens when the price, after breaking below support, pulls back to test that former support level—now acting as resistance.
This is a healthy market behaviour and adds credibility to the breakdown.

How to use the retest in your strategy:
Homework: Check the following two stocks and select the one that fits the horizontal resistance breakout pattern.
1. Five-Star Business Finance Ltd. (FIVESTAR)
2. ITC Ltd. (ITC)
You may also add the stock to your watch list to understand further price action.
Disclaimer: This analysis is purely for educational purpose and does not contain any recommendation. Please consult your financial advisor before taking any financial decision.