There are no items in your cart
Add More
Add More
| Item Details | Price | ||
|---|---|---|---|

When Markets Pause to Decide – Part 2
When Resistance Becomes Uneven
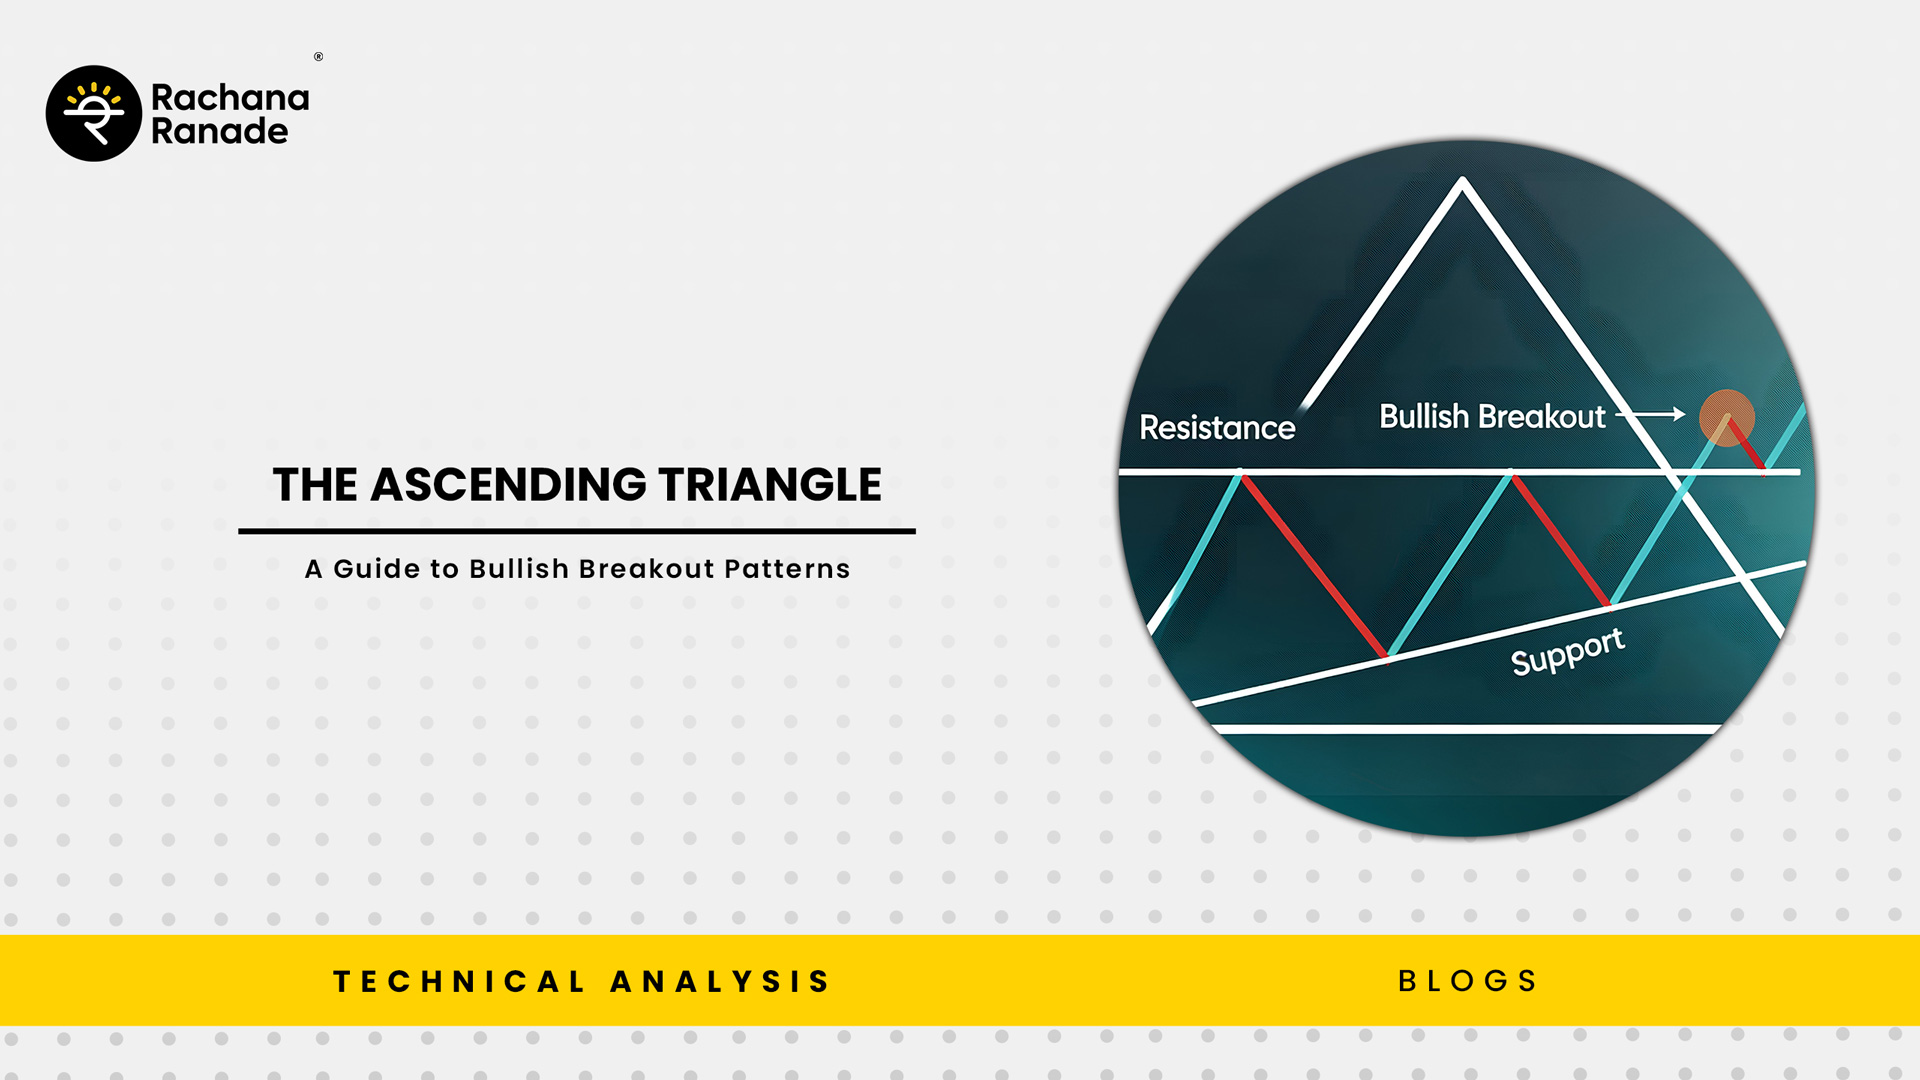
When stock prices frequently stall at a well-known horizontal resistance level and each decline finds support at a greater price than before, an ascending triangle is created. This produces a rising trendline (higher lows) and a flat upper boundary on a technical analysis chart. The price still seems to be fluctuating at first sight. However, there has been a shift in the price activity below. Deep pullbacks are no longer what buyers are waiting for. Even while sellers are still defending the same price range, they are reacting earlier. The bullish momentum becomes directional when the range gets smaller.
What the Market Is Actually Indicating
This pattern indicates that while supply is steady, demand is gradually losing its sensitivity to price. While buyers are growing more uncomfortable waiting for lower prices, sellers are only willing to sell at a certain resistance zone.
This situation is not urgent. During the formation, trading volume frequently stays low. However, every higher low subtly conveys the same message: purchasers are changing more quickly than sellers. The market is no longer neutral, but it is still calm.
The "Red-Pill" Perspective for Traders
Because of their shape, ascending triangles are frequently viewed as bullish. Yet, this continuation pattern is not driven by sudden optimism or excitement. It is driven by incremental conviction. Buyers are not aggressive; they are persistent. Sellers, meanwhile, are static. That asymmetry matters. Markets rarely move because one side suddenly panics; they move because one side runs out of patience first.
The Significance of Technical Patterns
The timing of an ascending triangle breakout is crucial. These structures frequently develop at times when market participation is still restricted prior to momentum trading becoming apparent.
The risk-to-reward ratio becomes clearer as the price compresses against resistance. The supply-demand mismatch that has been subtly developing during the consolidation stage is more important in the final resolution than the pattern itself.
Conclusion:
Patience with Direction An ascending triangle represents patience with direction. Nothing dramatic happens until the breakout occurs. The market appears calm, but beneath the surface, pressure has already started to lean one way.
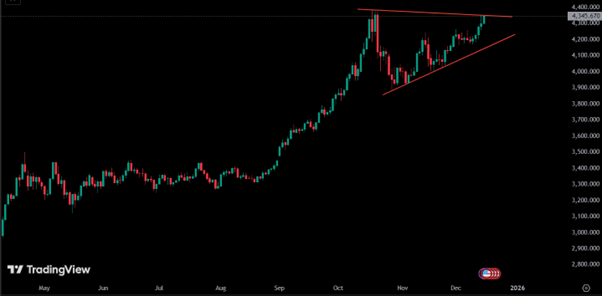
🔍 Practice Zone: Analyze These Stocks For practice, open your stock screening tools and check these 3 stocks to see if this chart pattern currently exists: