There are no items in your cart
Add More
Add More
| Item Details | Price | ||
|---|---|---|---|

In the realm of technical analysis, not all trend reversals are sharp and dramatic. Some evolve gradually, giving observant traders the opportunity to position themselves early. One such subtle yet reliable bullish reversal formation is the Rounding Bottom, also known as the Saucer Bottom. Recognizing this pattern can help traders anticipate long-term shifts from bearish to bullish sentiment, especially in longer timeframes like weekly or monthly charts.
The Rounding Bottom: A Slow Burn Reversal
The Rounding Bottom typically forms after an extended downtrend, indicating a slow transition from bearish control to bullish dominance. Unlike V-shaped recoveries, this pattern unfolds gradually, allowing accumulation over time before the breakout confirms the shift.
Pattern Anatomy
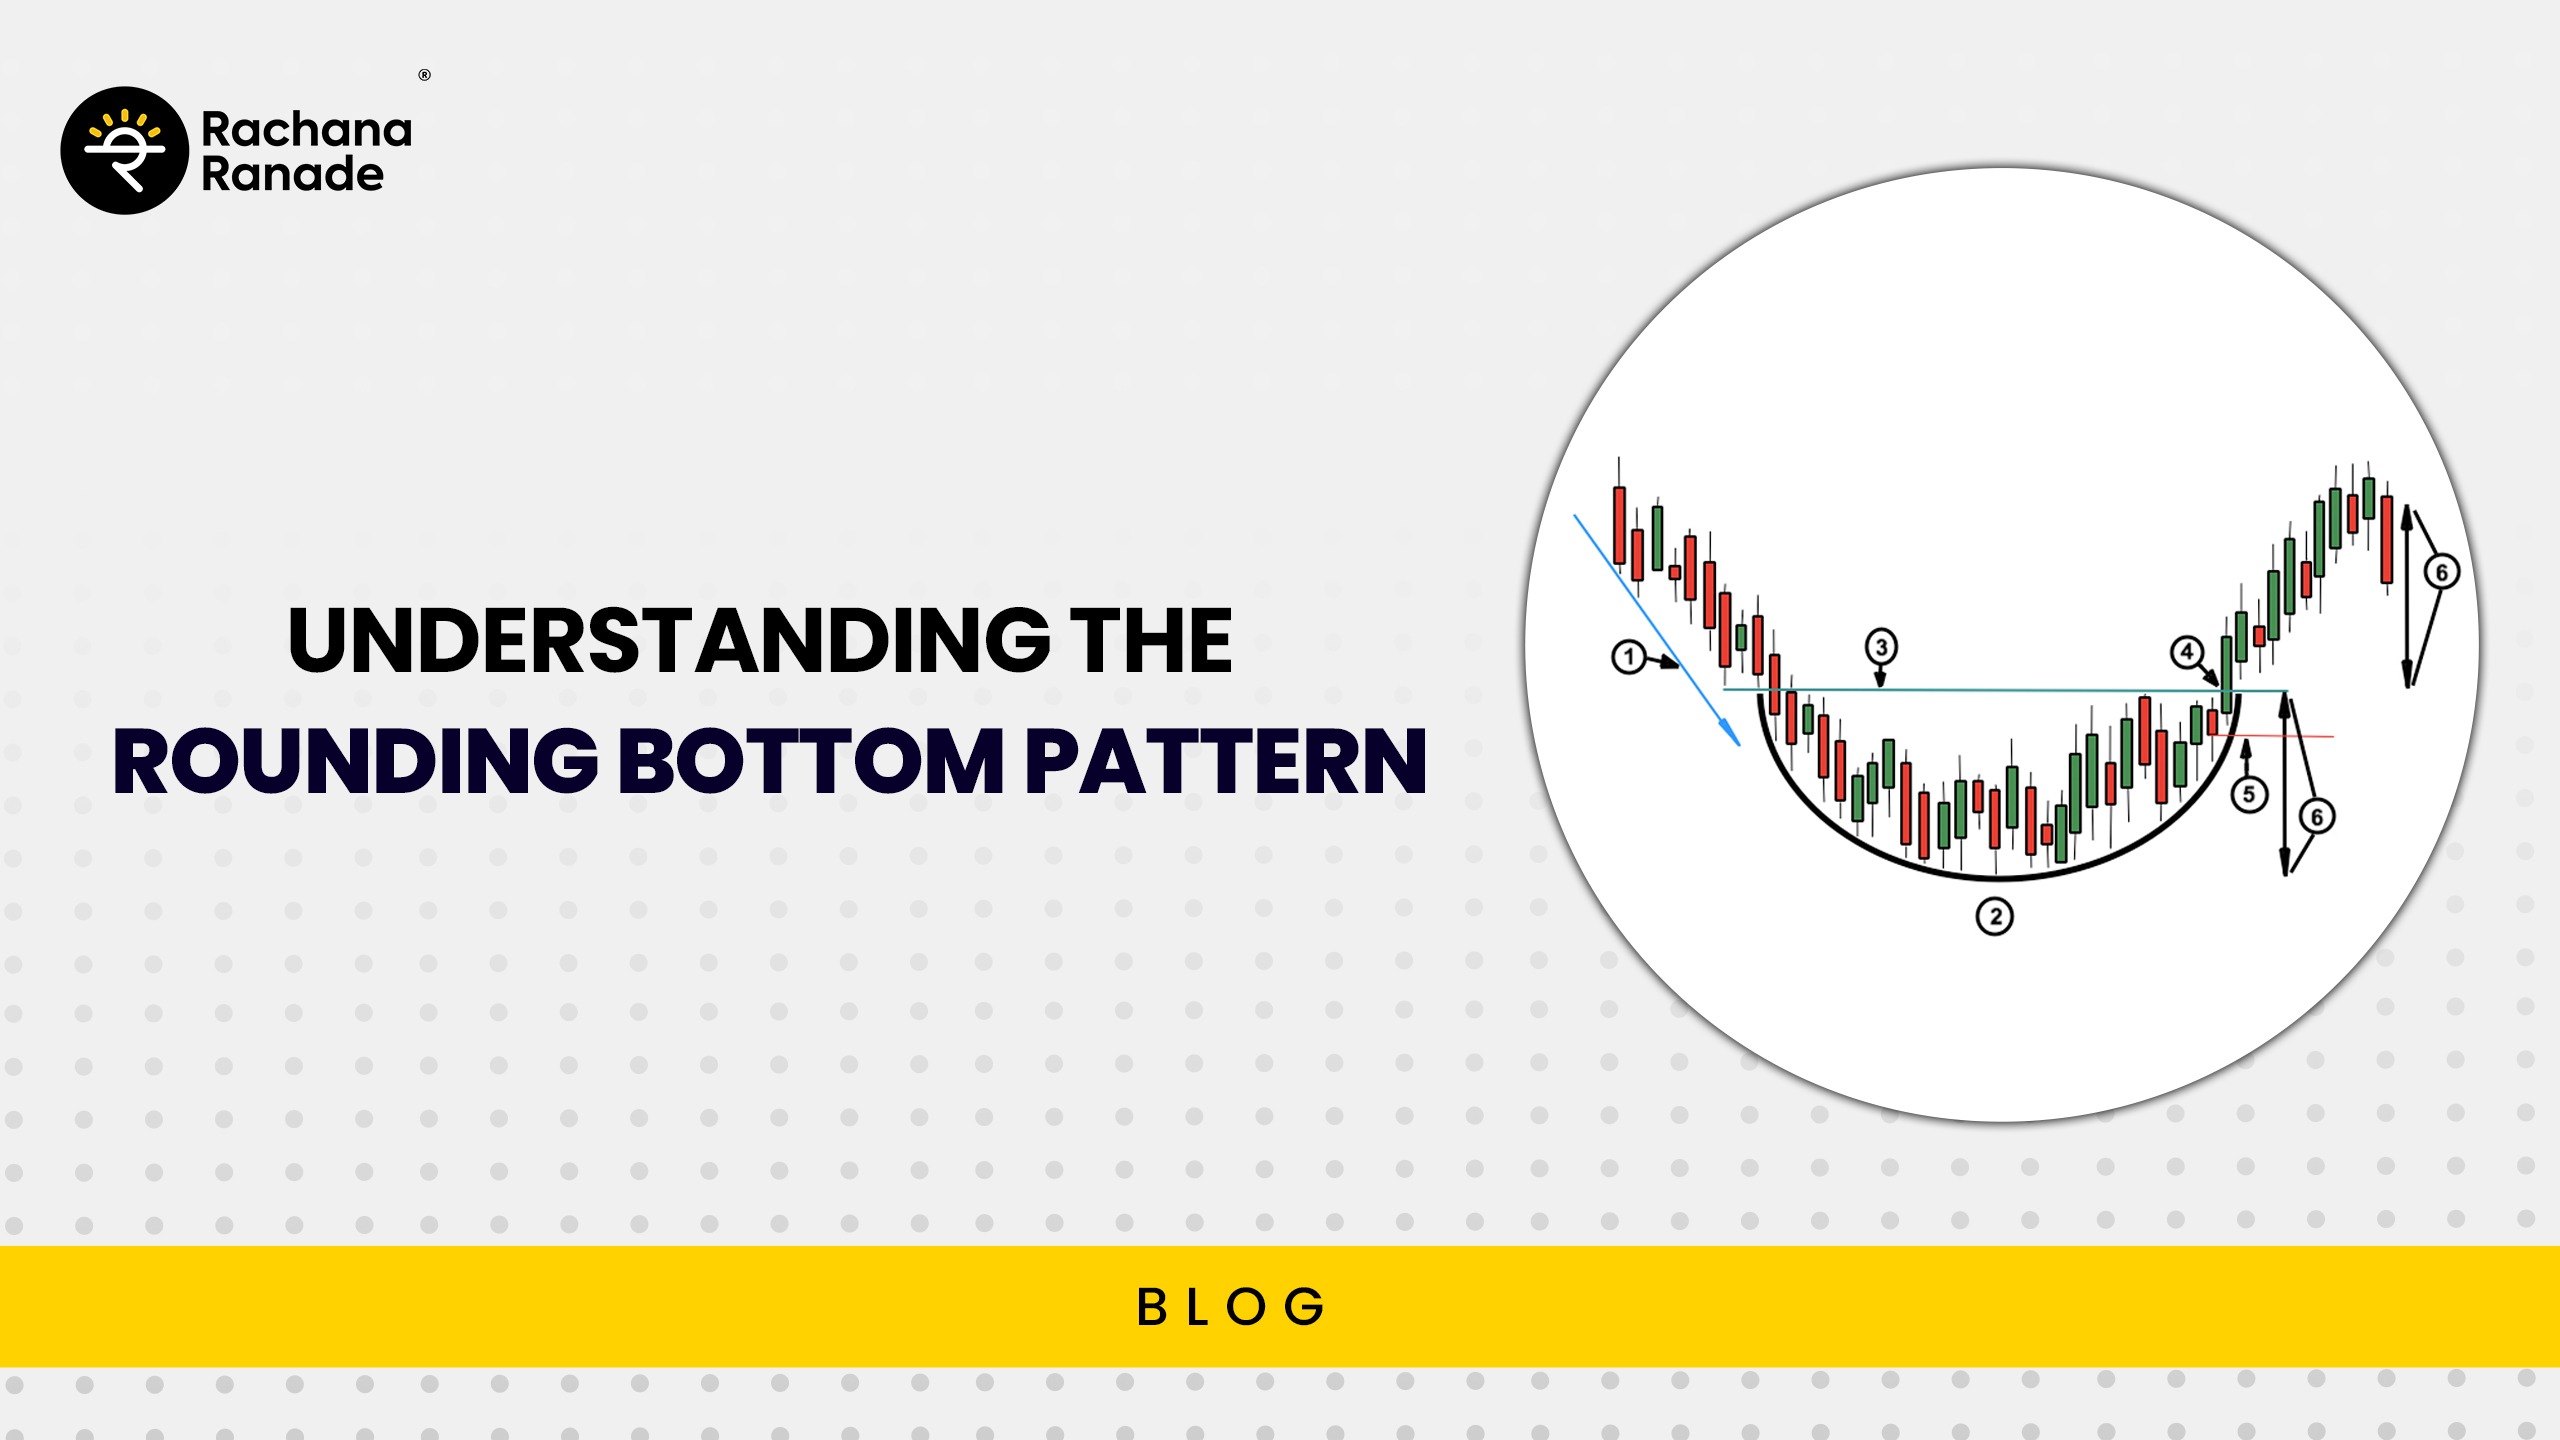
1. Decline Phase: Price continues its downtrend, often accompanied by diminishing volume, signalling seller exhaustion.
2. Bottoming Phase: A flattening of price action near the lows occurs. This is where accumulation quietly takes place, often missed by impatient traders.
3. Recovery Phase: Price starts to rise gradually, mirroring the initial decline and forming a smooth U-shape. Volume often begins to pick up here.
4. Resistance Line (Breakout Level): The horizontal resistance formed at the start of the decline marks the neckline or breakout point. A decisive break above this level completes the pattern.
Breakout and Retest: Confirmation is Key
A breakout above the resistance level, ideally on rising volume, confirms the Rounding Bottom pattern. This signifies that buyers have finally taken control.
Retest Opportunity: After the breakout, price may pull back to the breakout level. If the former resistance acts as support and holds, it strengthens the bullish case. Traders often use this retest to enter the trade with reduced risk.
How to Trade a Rounding Bottom Pattern
Entry Point